---
section: 55th
publicUrl: 'http://andoverct.info/reports/55th/weir-position/'
pageTitle: 'Where Weir Sits in the House — CT 55th House District'
title: Where Weir Sits in the House
subtitle: "Connecticut's 55th House District · Voting record 2023–2026 · Where Rep. Steve Weir falls on the ideological spectrum of the House, and how the 55th's lean compares"
attribution: 'A personal report by Scott Sauyet · scott@sauyet.com · Not an official town document'
banner:
left: CT 55th House District · Scott Sauyet's Reports
right: Weir voting record · 2023–2026
footer: 'Personal work of Scott Sauyet · Compiled June 11, 2026
Data from the Connecticut General Assembly, the Connecticut Secretary of the State, and U.S. Census geography. Not an official town document.'
pdf:
author: Personal work of Scott Sauyet · scott@sauyet.com
footer: andoverct.info/reports/55th/weir-position/
sectionLabels:
- - overview
- Introduction
- - note on methodology
- Methodology
- - part 1
- Background
- - part 2
- Findings
- - part 3
- Analysis
- - summary table
- At a glance
- - key observations
- Analysis
- - what this report does not show
- Caveats
- - sources
- Documentation
- - data and methods
- Reproducibility
- - methodology notes
- Technical notes
- - other formats
- Download
formats:
- icon: "\U0001F310"
title: HTML
href: ./
desc: Interactive version with formatted tables; best for on-screen reading and sharing.
- icon: "\U0001F4C4"
title: Markdown
href: weir-position.md
desc: 'Plain-text version; readable in any editor, ideal for copying into other documents.'
- icon: "\U0001F4D1"
title: PDF
href: weir-position.pdf
desc: 'Print-ready version with all tables, footnotes, and source citations.'
---
Where Weir Sits in the House
============================
*Methodology: This report places Connecticut House members on a single
left-right scale using W-NOMINATE, a standard spatial method that infers each
member's position from the pattern of their recorded roll-call votes. No
position is assigned by hand; the scale emerges from who votes with whom. The
scaling covers the 2025-2026 term, and for comparison the 2023-2024 term, using
all contested House roll calls published by the Connecticut General Assembly.
The result is a relative ordering within the chamber, not an absolute or
cross-state score. Each district's partisan lean
is a recency-weighted, turnout-weighted average of its towns' two-party vote for
President, U.S. Senate, U.S. House, and Governor across the nineteen general
elections from 2012 to 2024, aggregated from towns to districts by each town's
share of the district's 2020 census population (via the Missouri Census Data
Center's GEOCORR engine) and cross-checked against each town's share of 2024
State House turnout; the two weightings agree to a correlation of 0.997. For
towns split between districts, a town's lean is assumed uniform across its
parts. All sources are linked below, and the data inputs, outputs, and R source
are bundled with this report.*
Overview
--------
This report answers a narrow, factual question: relative to the other members of
the Connecticut House of Representatives, how conservatively does Rep. Steve
Weir (R, 55th District) vote, and how does that compare to the partisan lean of
the district he represents?
Two measurements are combined. The first places every member of the House on a
single liberal-to-conservative scale built only from their recorded votes. The
second estimates the partisan lean of every district from a dozen years of
election returns. Putting the two side by side shows both where Weir sits among
his colleagues and how that compares to where his district sits among all 151.
The findings are stable across both of Weir's terms: he votes among the most
conservative members of the House, to the right of his own party's leader, while
the 55th District leans Democratic in statewide and federal elections. This
report documents those numbers and the method behind them. It does not address
why he votes as he does, and it draws no conclusion about whether his record and
his district are appropriately matched; those are questions for readers and
candidates, not for a data report.
Part 1 — How the placement is measured
--------------------------------------
The scale used here is **W-NOMINATE**, the standard tool political scientists
use to locate legislators on an ideological spectrum from their votes. The
method makes no assumption in advance about which member is liberal or
conservative. It looks only at the pattern of agreement and disagreement across
hundreds of recorded votes: members who vote together repeatedly are placed near
each other, and the single dimension that best explains the overall pattern
becomes the left-right axis. Each member receives a coordinate, conventionally
running from about -1 to +1.
Two points about what the coordinate is, and is not. It is **relative**: it
locates a member within this chamber, for this period, not against any fixed or
national yardstick. And it is **earned from the hard votes**: near-unanimous and
lopsided votes carry little information and are set aside, so a member's
position is driven by the contested votes where the chamber actually divided.
For the 2025-2026 term that left 285 contested votes among the members scored.
Part 2 — Where Weir ranks in the House
--------------------------------------
Of the 153 representatives who served in the 2025-2026 term and cast enough
recorded votes to be placed, **Weir ranks 11th most conservative** — inside the
most conservative seven percent of the chamber. His position is essentially
unchanged from the prior term: in 2023-2024 he ranked 9th of 154, also inside
the top six percent. Across both terms he sits at the right edge of the House.
He also votes to the right of his own caucus's leadership. **House Minority
Leader Vincent Candelora ranks 19th; Weir ranks 11th**, more conservative than
the leader of the House Republicans. The same was true in the prior term, when
Candelora ranked 28th and Weir 9th.
Within the Republican caucus itself, Weir is not in the middle. Of the 49
Republicans placed in the current term, **he is the 11th most conservative**,
roughly the top fifth of the caucus, and well to the right of the Republican
caucus median. His nearest neighbors on the scale are Reps. Vail, Anderson,
DeCaprio, and Canino.
Part 3 — The 55th among the districts
-------------------------------------
The partisan lean of each district is estimated from how its towns actually
voted for President, U.S. Senate, U.S. House, and Governor over the 2012-2024
period, with more recent elections weighted more heavily. By that measure the
**55th District leans Democratic, with a two-party Democratic share of about
54.5 percent**, roughly a nine-point Democratic edge in top-of-the-ticket races.
Among the 151 districts, 45 are more Republican-leaning than the 55th and 105
are more Democratic-leaning; the 55th sits on the Democratic-leaning side of the
midpoint.
Plotting all 151 districts shows the expected pattern: more Republican-leaning
districts tend to elect more conservative members. But the relationship is
loose, and the 55th is one of the clearer departures from it. Weir votes as one
of the most conservative members of the House while representing a district that
leans Democratic at the top of the ticket.
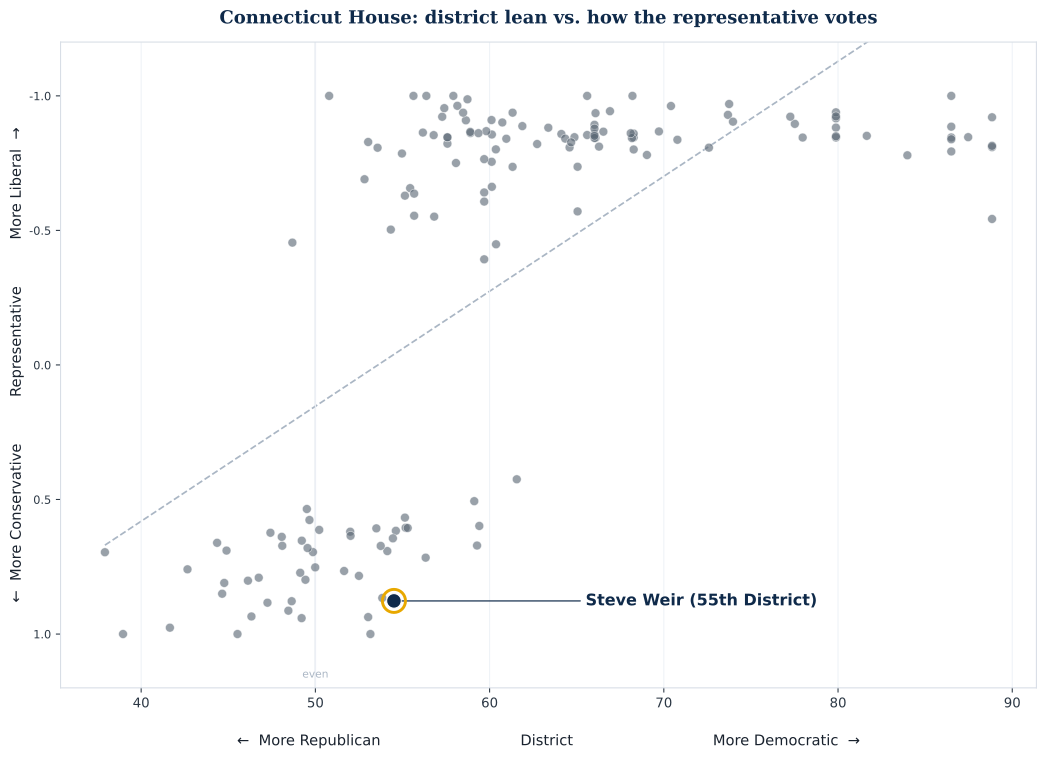
*Each dot is one of the 151 districts. The horizontal axis is the district's
partisan lean; the vertical axis is the representative's W-NOMINATE coordinate,
with the raw scale shown. Weir sits in the lower-right: a conservative voting
record in a Democratic-leaning district.*
Weir is not unique in this. About twenty Republicans hold seats that lean
Democratic in top-of-the-ticket voting, which is in part simply what it means to
be a Republican in a Democratic-leaning state. What distinguishes the 55th is
the combination: among those Republicans in Democratic-leaning seats, **only two
(Reps. Fishbein and Pavalock-D'Amato) have more conservative voting records than
Weir.** Measured as the distance between a member's record and what their
district's lean would predict, the 55th is among the three or four widest gaps
in the House.
Summary Table
-------------
| Measure | Value |
| ------------------------------------------------- | --------------------------------- |
| Weir's rank among all members, 2025-2026 | 11th most conservative of 153 |
| Weir's rank among all members, 2023-2024 | 9th most conservative of 154 |
| Weir's rank within the Republican caucus, 2025-26 | 11th of 49 |
| Weir vs. the House Minority Leader (Candelora) | More conservative (11th vs. 19th) |
| 55th District two-party Democratic share | ~54.5% (about D+9) |
| Districts more Republican-leaning than the 55th | 45 of 151 |
| Republicans in Democratic-leaning seats more | 2 (Fishbein, Pavalock-D'Amato) |
| conservative than Weir | |
Key Observations
----------------
**Weir's record is consistently among the most conservative in the House.** He
ranks 11th of 153 in the current term and 9th of 154 in the prior one — the same
position in any meaningful sense, at the right edge of the chamber, across both
terms he has served.
**He votes to the right of his own party's leadership.** The House Minority
Leader ranks 19th; Weir ranks 11th. This is a statement about voting records,
not about formal roles.
**The 55th District leans Democratic in top-of-the-ticket elections.** Over
2012-2024 its towns gave Democrats roughly 54.5 percent of the two-party vote
for President, Senate, U.S. House, and Governor. The district nonetheless
re-elects a Republican to the state House, which is a fact about candidate-level
voting that this report does not attempt to explain.
**The record-to-district gap is wide but not unique.** Many Connecticut
Republicans represent districts that lean Democratic at the top of the ticket.
What sets the 55th apart is that Weir pairs such a district with one of the most
conservative voting records of any of them.
What this report does not show
------------------------------
- **Why Rep. Weir votes as he does.** This report measures his voting record and
his district's lean. It makes no claim about his reasoning, his priorities, or
his responsiveness to constituents. Public statements from Rep. Weir are the
place to look for that.
- **How the 55th votes for state representative.** The district-lean figure is
built from President, Senate, U.S. House, and Governor races. That a
Democratic-leaning district keeps electing a Republican state representative
is a real and separate fact; this report neither predicts nor explains
state-House election outcomes.
- **An absolute or national score.** W-NOMINATE places members relative to one
another within the Connecticut House for the period scaled. A coordinate here
is not comparable to a coordinate from another state or another body.
- **The lean of split-town fragments.** For towns divided between districts, the
whole town's lean is applied to its piece of the 55th. Where a split town's
parts differ politically, that introduces some error; for the 55th the split
towns (Bolton and Glastonbury) are a minority of the district.
- **Movement over time as a precise figure.** The two terms are scaled
separately, so they are compared by rank and percentile, not by raw
coordinate. The comparison shows stability, not a measured shift.
Sources
-------
### Voting records and roster (Connecticut General Assembly) ###
- [House roll-call vote PDFs (CGA bill and vote
search)](https://www.cga.ct.gov/asp/cgabillstatus/CGAbillstatus.asp)
- [House of Representatives member
list](https://www.cga.ct.gov/asp/menu/hlist.asp)
### Method and scaling ###
- [Poole & Rosenthal W-NOMINATE — `wnominate` R package
(CRAN)](https://cran.r-project.org/package=wnominate)
- [`pscl` R package (rollcall objects, IRT ideal
points)](https://cran.r-project.org/package=pscl)
- [Shor & McCarty, state-legislature ideal-point data (validation
reference)](https://dataverse.harvard.edu/dataset.xhtml?persistentId=doi:10.7910/DVN/NWSYOS)
### District lean and geography ###
- [Connecticut election results
(electionhistory.ct.gov)](https://electionhistory.ct.gov/)
- [2024 Statement of Vote, Connecticut Secretary of the State
(PDF)](https://portal.ct.gov/-/media/sots/electionservices/statementofvote_pdfs/2024_statement_of_vote.pdf)
- [Town-to-district population crosswalk — Missouri Census Data Center
GEOCORR](https://mcdc.missouri.edu/applications/geocorr.html)
Data and methods
----------------
Every input and output behind this report is included in this folder so the
analysis can be reproduced or audited. The scaling was run in R; the data
preparation and aggregation in Python and Node.
- [`scale-ct-house.R`](scale-ct-house.R) — the R script that scales the vote
matrix and ranks members
- [`ct-house-2025-2026-votematrix.csv`](ct-house-2025-2026-votematrix.csv) —
current-term roll-call matrix (input)
- [`ct-house-2023-2024-votematrix.csv`](ct-house-2023-2024-votematrix.csv) —
prior-term roll-call matrix (input)
- [`ct-house-party-roster.csv`](ct-house-party-roster.csv) — member-to-party
roster (input)
- [`ct-house-conservatism-ranking-25-26.csv`](ct-house-conservatism-ranking-25-26.csv)
— current-term ranking (output)
- [`ct-house-conservatism-ranking-23-24.csv`](ct-house-conservatism-ranking-23-24.csv)
— prior-term ranking (output)
- [`district-lean-vs-conservatism.csv`](district-lean-vs-conservatism.csv) —
merged district lean and ranking (output)
- [`geocorr-town-to-district.csv`](geocorr-town-to-district.csv) —
town-to-district population crosswalk (input)
- [`weir-position-chart.svg`](weir-position-chart.svg) — the chart above
Other Formats
-------------
This report is available in two formats, both located alongside this page: